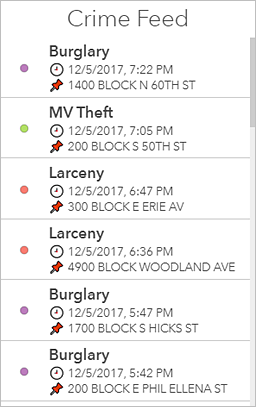
A list is used to show features or rows from a layer. When available, field formatting information in a list is based on information found in the layer's pop-up. However, as with all data-driven elements, you can create filters for lists to limit the amount of information they display. You can also limit the number of features displayed in a list at once. Additionally, you can specify the order in which the features are sorted in the list. For example, you can configure the list so that rows with certain attributes for a date-based field appear near the top, which is particularly important in real-time scenarios.
You can also adjust how the information is displayed in a list by using the rich text editor when configuring it. Furthermore, since lists show layer rows or features, you can insert field values directly into the displayed text. To do this, click Insert  and choose your desired field. At run time, the field values will be interpreted and displayed. See Effective Use of HTML for details.
Tip:
If you do not like how dates or numbers are displayed, you can change the configuration of the layer's pop-up in Map Viewer. Your updates will be reflected in the list. See Configure pop-ups for details.
A list can also be configured to have a single row or multiple row selection mode. Which selection mode to choose is an important consideration when you are building an interactive dashboard in which a list can be either the source or target of an action. When a list is the source of an action, it can, for example, trigger a map to pan or zoom. Conversely, when a list is the target of an action such as a map extent change, the list can filter so the data it displays corresponds with the map's new extent.